
How Can We Help?
Calculating on your driver in the data storyCalculating on your driver in the data story
A little tip on how to get more out of your data story
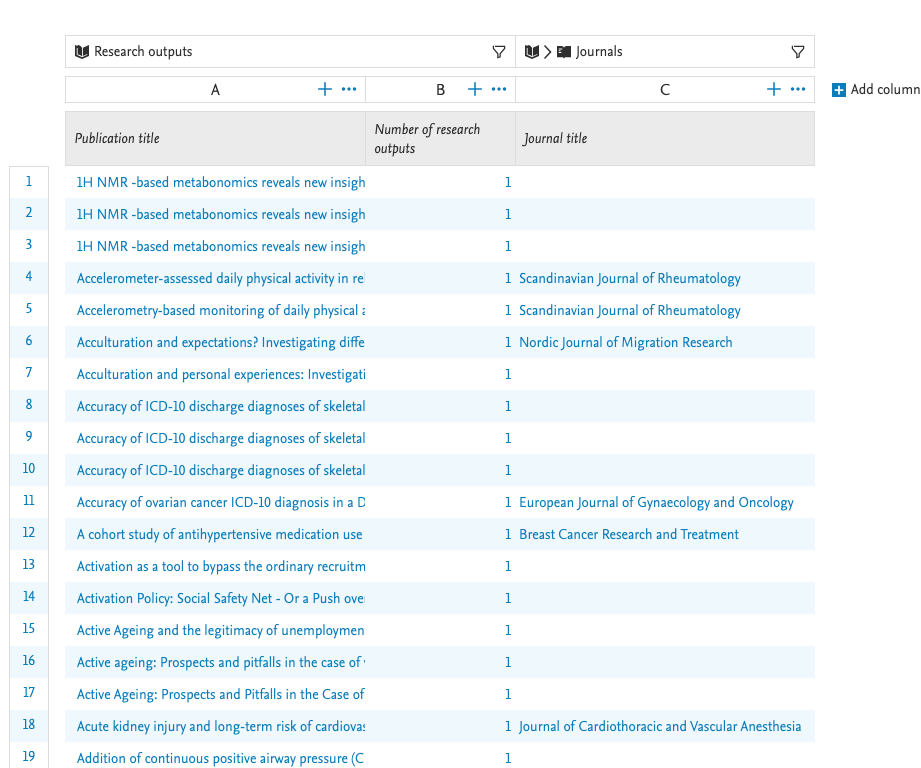
When creating a report, you start by selecting a content type you would like to report on (column A in your report = driver). We start by listing the title of the content in each row.
Often in your data story, you would like to do some calculations on this, by adding it as a measure. But because it is text, it can only be added as a dimension.
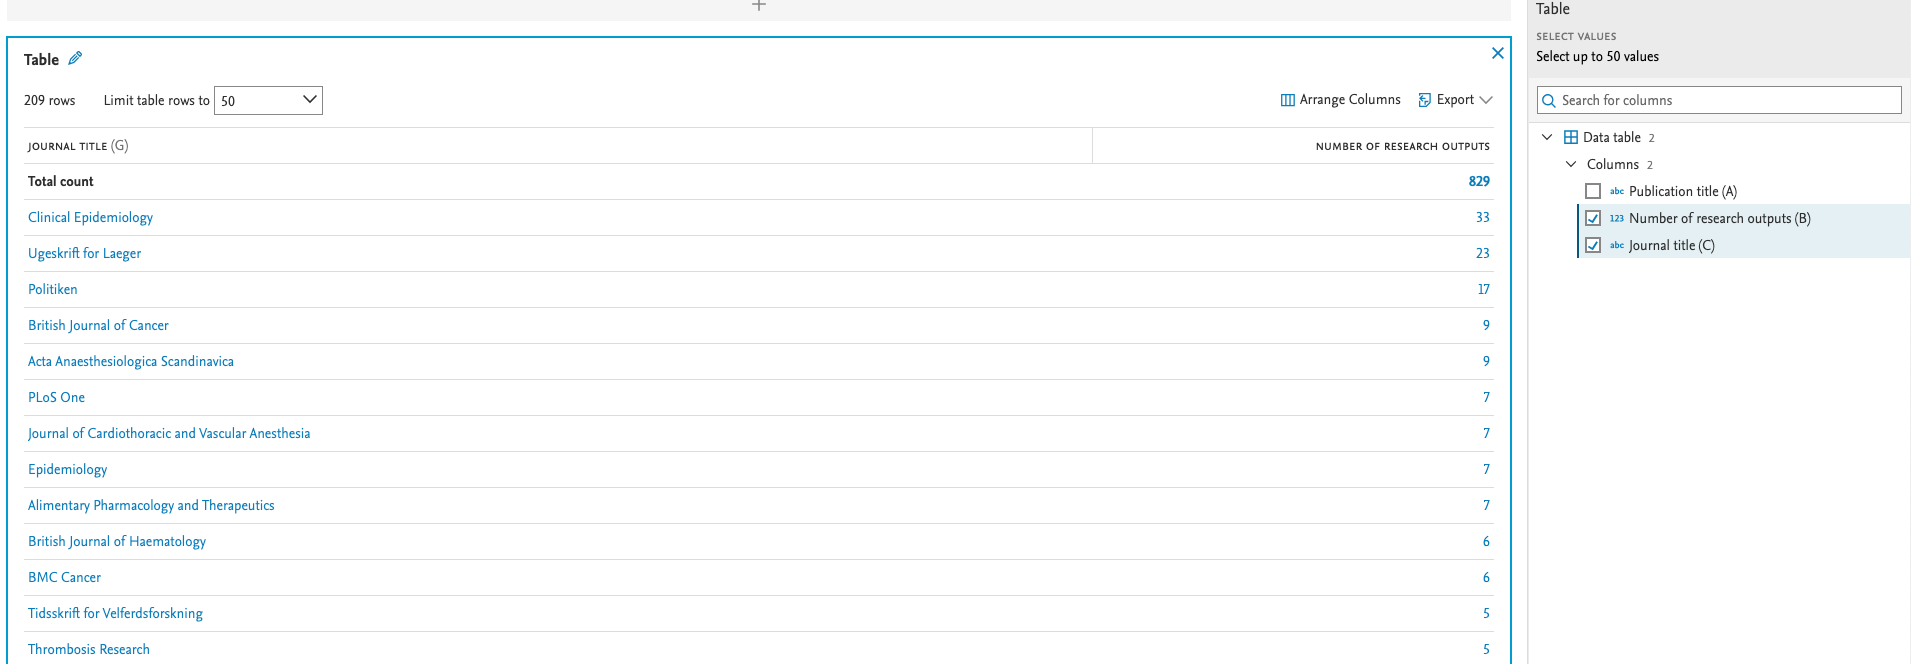
A way to get around this, is by adding a second column to your data table. Here, you add the value "Number of XX". This now gives you the option in the data story to use your driver as both a measure and a dimension.
Screenshot
Published at December 04, 2023