Sign up now for Client Certification Foundation Course - June cohort!
Pure's logos
Pure Help Center for Pure Administrators

If you are a researcher, or other non-admin at your institution, click here.

  • Home
  • Announcements
  • Release Notes
  • Technical user guides
  • Training
  • Events
  • Support
  • Contact Us
  • Home
  • Knowledge base articles
  • Reporting
  • Example Workspaces
  • Tips-n-tricks

How Can We Help?

Search Results

Filter By Category

Contact Us

If you still have questions or prefer to get help directly from an agent, please submit a request.
We’ll get back to you as soon as possible.

Contact us

Data story - table widgetData story - table widget

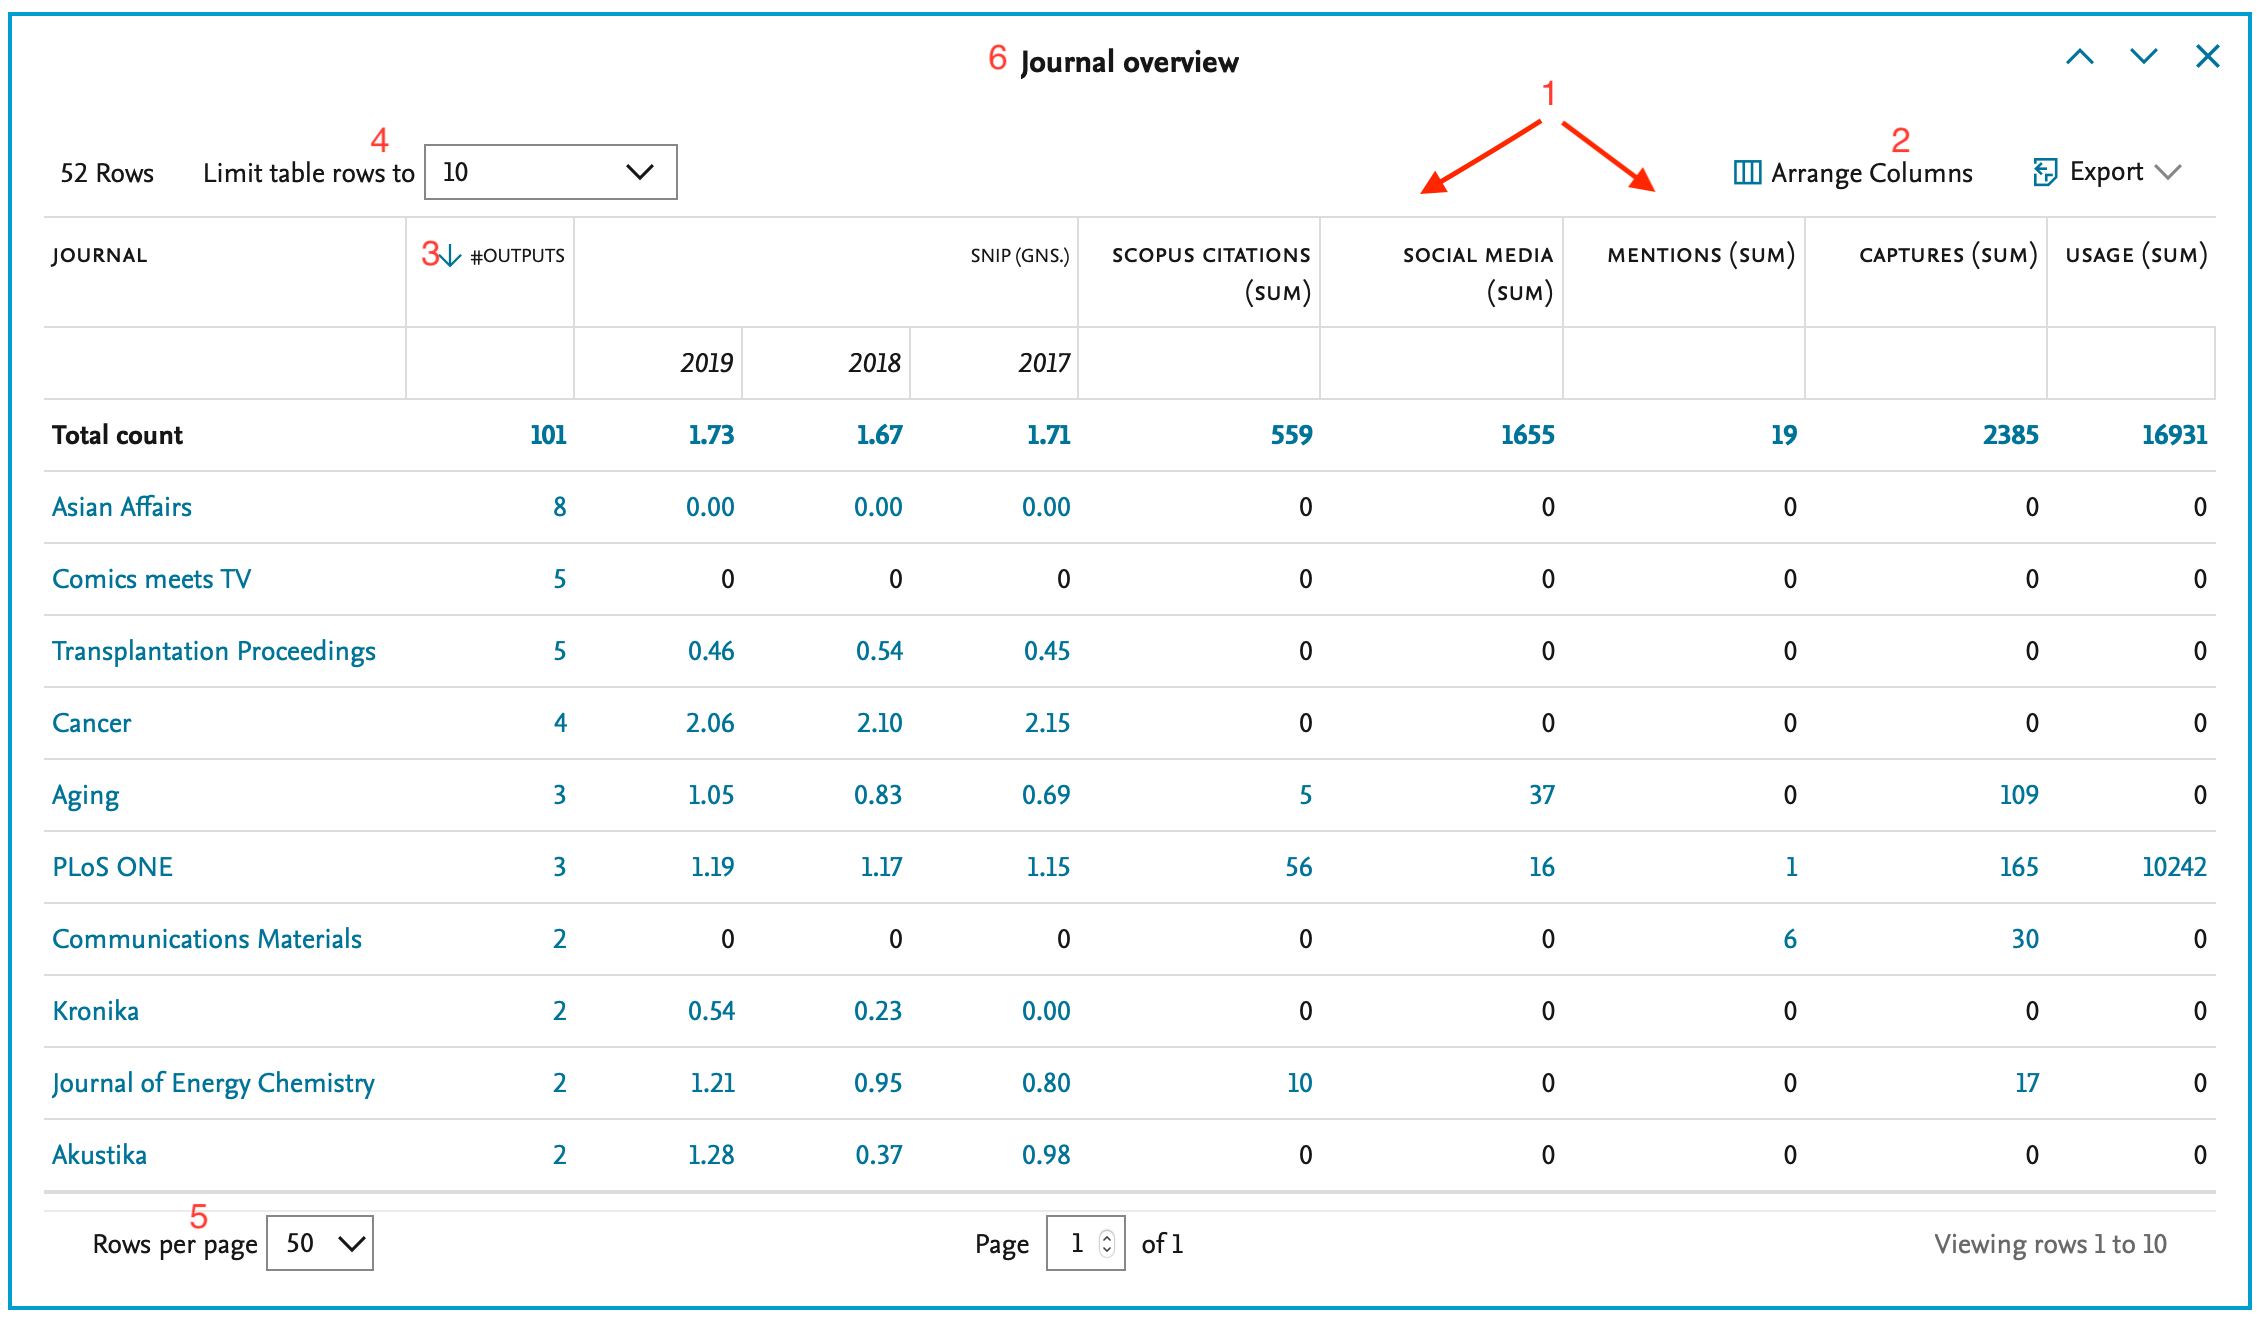
The table widget is my favourite widget :) The reason is, that is providing a lot of flexibility in creating the different “stories” you are seeking in your data set, and it provides a lot of possibilities in exploring new and perhaps hidden stories in the data set you have collected. A few examples of how you can work with the table widget:


  1. You can add multiple dimensions and measures to the table
    1. Adding more dimensions/measures tells new or perhaps better stories
  2. After adding your dimensions/measures you can rearrange the columns, thereby perhaps highlighting a specific dimension 
  3. You can sort the table in different ways by clicking on the column header (on most columns)
  4. You can limit your table to only a certain number of rows (this can be used to find top X - like most used journals, or researcher who was awarded most money)
  5. You can separate your table into multiple pages, deciding who many rows should be in on one page
  6. You can update the header title of the widget, thereby better explain to the end user what the widget is about


Screenshot


Published at December 05, 2023

Download
Table of Contents
  1. Screenshot
Related Articles
  • Play with the data in the data story, to gain new insights into your data
  • Print data story
  • Creating relations
  • Rearranging columns in the data table (data story)
Keywords
  • tips-n-tricks
  • data-story

Was this article helpful?

Yes
No
Give feedback about this article

    About Pure

  • Announcements

    Additional Support

  • Events
  • Client Community
  • Training

    Need Help?

  • Contact Us
  • Submit a Support Case
  • My Cases
  • Linkedin
  • Twitter
  • Facebook
  • Youtube
Elsevier logo Relx logo

Copyright © 2025 Elsevier, except certain content provided by third parties.

  • Terms & Conditions Terms & Conditions
  • Privacy policyPrivacy policy
  • AccesibilityAccesibility
  • Cookie SettingsCookie Settings
  • Log in to Pure Help CenterLog in to Helpjuice Center

Knowledge Base Software powered by Helpjuice

Expand