
How Can We Help?
Research Activity Per Year Graph in the PortalResearch Activity Per Year Graph in the Portal
What
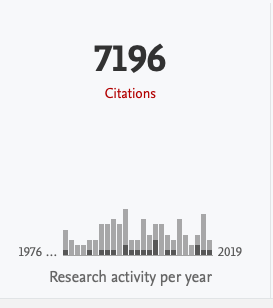
Person profiles on the Portal may (or may not) have a 'Research activity graph' as displayed below. It shows the amount of Research outputs and Projects per year.
- Research Output = light grey
- Projects = dark grey
How
To enable or disabled the graph you can go to:
- Administrator > Pure Portal > Configuration > Content types > Persons - Click Edit and find "Remove research output graph".
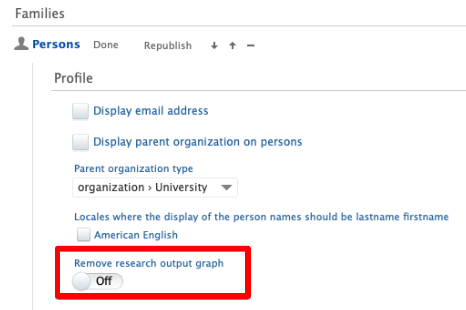
- If the toggle is OFF:
- The "Research activity per year" graph displays when there's at least one record (Research outputs and/or Projects) related to the Person.
- From Pure 5.20.0 the graph in the Portal is updated to be display "Research activity per year" including both Research outputs and Projects, rather than only "Research outputs per year".
- If the toggle is ON:
- The graph and text is removed from the Person profile:
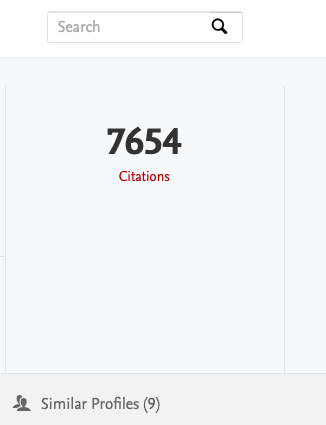
- The graph and text is removed from the Person profile:
More information
Note: Some of this information is for internal use only and might not be accessible.
Published at October 25, 2023